الطاقة وإدارة المرافق
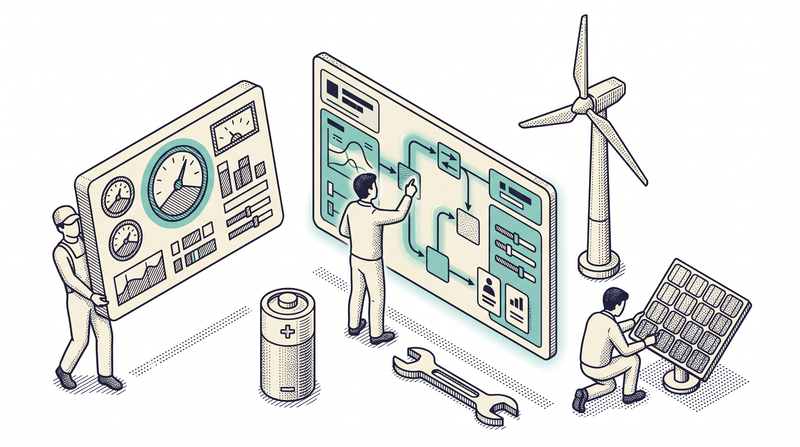
Managing a building and facility through the eyes of software
A facility or building complex spends its day in a quiet balance: the elevator must run, the generator must wait ready, meters must be read, faults must be cleared before they pile up, the energy bill must not spin out of control. What keeps that balance is usually the memory of a few people and a heap of spreadsheets. Vosetu moves that invisible labor into one system — from asset inventory to planned maintenance, from meter data to fault requests, the same record, the same owner, the same history.
Talking to hardware is not new for us. In our field projects we've read data from devices, sensors and meters; on the site and facility-management side we've run fault-request flows, planned-maintenance calendars and resident/manager communication in real operations. Your facility backbone is built on those two experiences: the software speaks the same language to the person at the dashboard and to the device on the wall.
- Assets + maintenance + energy in one place
- Live link to meters & sensors
- From fault request to work order
- Threshold alerts as standard
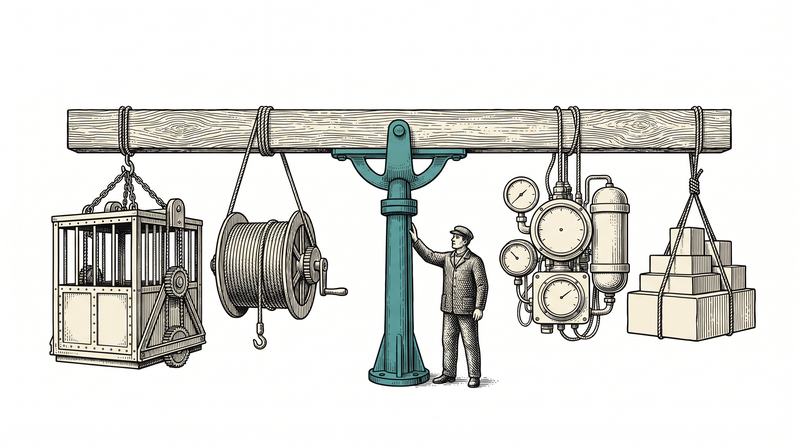
The modules that keep a facility's pulse
Each module turns on independently yet shares a common asset record and event history — a fault, a meter deviation and a maintenance ticket meet under the same equipment.
Asset & equipment inventory
Every device, line and area is on record: its location, warranty, maintenance history and linked meters on one card.
Planned maintenance (CMMS)
Periodic maintenance is bound to a calendar; the due job drops in on its own, and a skipped service doesn't slip past.
Fault & request management
A resident, user or sensor reports a fault; the request is prioritized, assigned to a team and tracked until resolved.
Meter & sensor reading
Electricity, water, gas and heat meters plus temperature/humidity sensors are read periodically or in real time.
Energy monitoring & consumption
Consumption is tracked by building, floor and device; abnormal spikes and leaks are caught early.
Alarm & threshold alerts
A value over threshold, an outage or an anomaly instantly raises a notification — by SMS, email and on the dashboard.
Inspection & control rounds
Periodic checklists drop to the field team on mobile; each item is marked off with a photo and note.
Expense & dues tracking
Facility expenses, maintenance cost and dues/collections in one ledger; advancing in reconciliation with accounting.
Management dashboard
Open faults, upcoming maintenance, energy trends and active alarms at a glance; shaped by role.
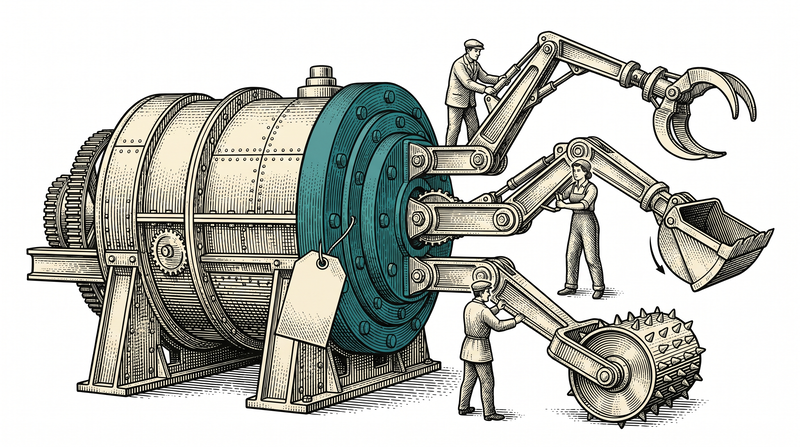
Where hardware meets software
Device & meter bridge
The system talks directly to field hardware: it exchanges data with meters, sensors and control units over industrial protocols. An edge gateway collects the data and carries it to the center; when the connection drops it buffers locally and syncs on return — no data loss.
- TCP/IP, Modbus, OPC-UA
- MQTT & edge gateway
- Offline buffer-and-sync
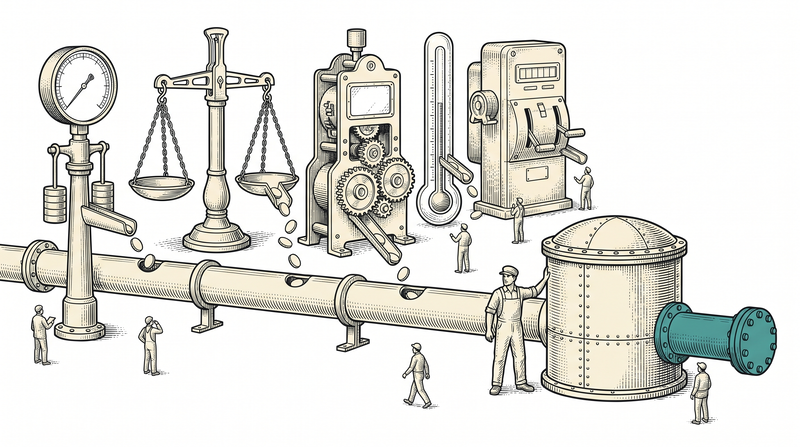
Fault workflow engine & SLA
A fault report — whether from a sensor or a person — drops into the same engine: routed by category and priority, assigned to a team, its resolution time bound to an SLA, escalated if the time is breached. We've run this flow in real operations in our site and facility-management product — a fault is not 'forgotten', and its history is not lost.
- Priority, assignment and escalation
- SLA-bound resolution-time tracking
- Fault history per equipment
Energy dashboard & trend
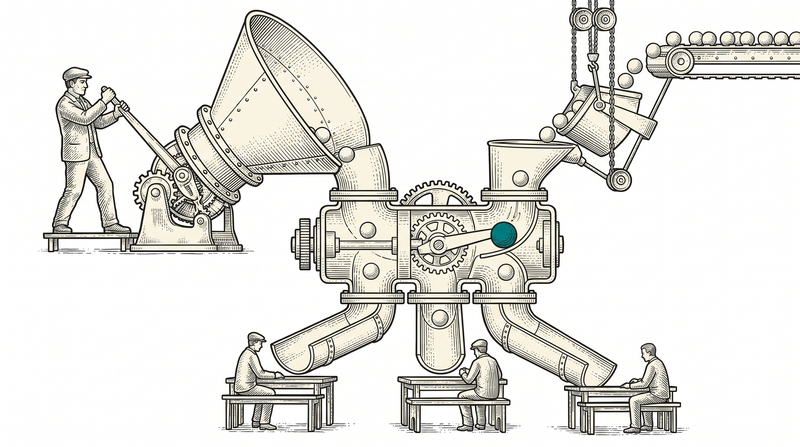
Raw meter data means little on its own; what turns it into a readable picture is comparison. Consumption is benchmarked against last month, last year and a comparable building; an abnormal deviation becomes an alarm. The manager doesn't guess where waste is — they see it on the dashboard.
- Building/floor/device breakdown
- Period-over-period comparison
- Automatic alarm from deviation
The technology we build on
- .NET 9
- ASP.NET Web API
- PostgreSQL
- TCP/IP
- Modbus
- OPC-UA
- MQTT
- edge gateway
- Real-time dashboard
- Threshold alarm
- Flutter
- SMS
What ships as standard in every facility deployment
How we bring your facility live
Site survey & inventory
We walk the building and equipment on site and determine which device speaks which protocol and which data will be read.
Hardware connection & test
We connect meters, sensors and control units to the system via the edge gateway and verify the data flow in a live environment.
Maintenance & fault flow setup
We set up the planned-maintenance calendar, fault priorities, SLA rules and team roles; and define alarm thresholds.
Training, go-live & care
We train your team and stand by in the first days; then we continue updates and support under an SLA maintenance plan.
Frequently asked
Which meters and sensors does it work with?
It works with devices that expose data over industrial protocols (Modbus, OPC-UA, TCP/IP) and MQTT. An edge gateway aggregates different-brand field devices at one point; adding a new device type means writing an adapter without touching the core. In the pre-deployment site survey we determine how each device will connect.
Is data lost if the internet drops?
No. When the connection drops the edge gateway buffers readings locally; when it returns they sync to the center. So consumption and alarm data from the outage window also make it into the records in full.
Is your site/building-management experience real?
Yes. We've run the fault-request flow, the planned-maintenance calendar and resident/manager communication in real operations on the site and facility-management side. Our energy and hardware-integration experience comes from our field projects; in this vertical our aim is to merge those two bodies of experience into a single facility backbone.
Is it suitable for a multi-building facility group?
Yes. Buildings are managed in one system with a shared asset and permission model; each user sees only the data of the building they're authorized for. The central dashboard compares buildings on energy and maintenance while fault and consumption data stay separated per building.
Let's make your facility measurable and monitorable
We'll listen to your equipment and energy flow and map out where to start, together. The first conversation is non-binding.